
FX Trendlines
AIによる英訳ですThis has been translated into English by AI.
Master FX Trendlines: Capture Market Movements with Ease!
In the FX world, understanding market direction is crucial. One of the simplest yet most powerful tools for this is the FX trendline. Even beginners can use it to visualize price movements. Let’s explore the basics and practical applications of trendlines in a clear and simple way.
✅ What is a Trendline?
A trendline is a line drawn on a chart to make price trends more visible. For an uptrend, connect lows; for a downtrend, connect highs.
📈 How to Draw Basic Trendlines
Here are three key points to remember:
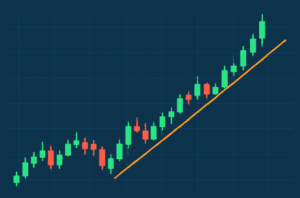
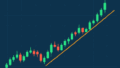
🌟 1. Uptrend Line
Connect two or more lows to draw the line. This often acts as support where prices bounce back up.
🔻 2. Downtrend Line
Connect two or more highs. This line often serves as resistance where prices are pushed down.
✏️ 3. Spotting Breakouts
When the price breaks through a trendline, it can signal a potential change in market direction. This is called a “breakout.”
💡 Make FX Trendlines Your Ally!
Using FX trendlines helps reduce unnecessary trades and creates more opportunities for profit. This simple method can become a powerful tool with practice.
Try incorporating trendlines into your daily chart analysis to better understand market movements!

コメント