
Make FX Easier with Simple Moving Averages

AIによる英訳ですThis has been translated into English by AI.
🌟 Make FX Easier with Simple Moving Averages!
Hello! Today, we’ll break down “FX simple moving averages” in a fun and easy-to-understand way. Even middle schoolers can follow this, so relax and enjoy!
📊 What Is a Simple Moving Average?
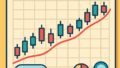
A simple moving average (SMA) is a line that shows the average price over a set period. It’s one of the most popular tools in FX charts, helping traders see trends more clearly.
💡 Why Is It Important?
SMAs help you spot the market’s direction. If the price is above the SMA, it’s often an uptrend. If below, it might signal a downtrend. This makes deciding when to buy or sell easier.
🚀 Pros and Things to Watch Out For
Pros
- Makes charts easier to read
- Helps spot trend changes
- Beginner-friendly and intuitive
Watch Out For
- Can give false signals in sideways markets
- Might react slowly to rapid price changes
🛠 Basic SMA Settings
Common periods for SMAs include:
- Short-term (5 or 10 days): For quick trends
- Medium-term (25 or 50 days): A balanced view
- Long-term (100 or 200 days): To see big-picture trends
📈 Example: How to Use SMAs
- Add an SMA to your chart
- Check where the price is in relation to the SMA
- If SMA is rising, consider buying; if falling, consider selling
- Combine multiple SMAs to watch for crossovers
⚠ Don’t Forget Risk Management!
Don’t rely on SMAs alone—set stop-losses and manage your funds carefully. This is the key to trading long-term.
✨ Wrap-Up
The FX simple moving average is a beginner-friendly yet powerful tool. Learn the basics, and trading will feel much clearer and more fun!
“Thanks for reading!” I hope this helps make your FX journey smoother.

コメント