
FX Candlestick Lower Wicks
AIによる英訳ですThis has been translated into English by AI.
Spot Market Bottoms with FX Candlestick Lower Wicks!
In FX trading, candlestick charts are essential. Among them, the “FX candlestick lower wick” deserves special attention. In this article, we’ll explain what lower wicks mean and how to use them in trading, all in a fun and beginner-friendly way.
📉 What Is an FX Candlestick Lower Wick?
The “lower wick” shows that prices dropped sharply for a time but then recovered. This means sellers dominated for a moment, but buyers pushed the price back up before the period ended.
💡 What Does a Long Lower Wick Mean?
A long lower wick often suggests “strong buying support”. If this appears during a downtrend, it can signal a potential rebound.
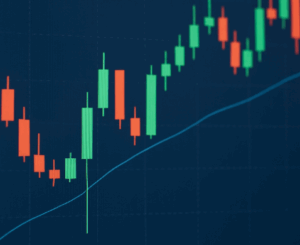
📊 Reading It on Charts
For example, when you spot a long lower wick on a daily chart, it often indicates sellers were overpowered by buyers. This might hint at a trend reversal.
⚠️ Points to Watch
Keep in mind that a lower wick doesn’t guarantee prices will rise. Combine it with other indicators and market context for smarter decisions.
✨ Use FX Lower Wicks to Your Advantage!
Understanding the FX candlestick lower wick will help you spot better entry and exit points. I hope this guide brings success to your trading and becomes something you’re grateful for!

コメント